We've been running a live regime detection system for the past few months, scoring every prediction against actual SPY outcomes. When we calibrated the system against 1,300+ historical regime outcomes spanning December 2020 through February 2026, the numbers were clear:
- Direction accuracy (did we correctly call bullish or bearish): 25-54%
- Character accuracy (did we correctly call calm, trending, or volatile): 75% weighted average across regime types and horizons
Same model. Same predictions. Same market data. The regime system was actually working — we were just grading it on the wrong dimension.
The direction trap
It's natural to frame regime detection as a directional problem. "Are we in a bull market or a bear market?" feels like the fundamental question. And it maps neatly onto trading decisions: go long in bull regimes, go short or sit out in bear regimes.
But daily and weekly market direction is inherently noisy. Even during clearly bearish macro environments, individual sessions regularly close green. Even during bull runs, pullbacks are frequent and unpredictable. When you score a regime model on whether it correctly predicted the direction of the next 1-5 trading days, you're asking it to do something that the best macro models in the world struggle with.
We found that no amount of tuning — VIX thresholds, term structure analysis, momentum overlays, multi-model consensus — pushed direction accuracy meaningfully above the 50-60% range. In some regimes, direction accuracy dipped to 25% — worse than random — which means the model was systematically wrong about direction in those conditions. Even that is useful information (contrarian signal), but it underscores the point: direction is not where regime detection has edge. At the aggregate level, it's a coin flip with extra steps.
What character gets right
Market character — whether conditions are calm, trending, or volatile — is a fundamentally different prediction. And it resolves much more cleanly.
The reason is straightforward: character is about the magnitude and shape of price movement, not the sign. A trending market moves 0.8%+ in a session. A calm market stays inside a tight range. A volatile market swings wide. These are measurable properties that tend to persist across sessions and are driven by identifiable structural factors like volatility levels, cross-asset correlation, and liquidity conditions.
Direction requires predicting which way the market moves. Character requires predicting how it moves. The second question has a much higher signal-to-noise ratio.
Why character is more actionable than direction
Here's the counterintuitive part: character is arguably more useful for trading than direction.
Consider what you actually need to manage a position effectively:
In calm markets, tighter stops work because the market isn't swinging through them randomly. Mean-reversion setups thrive. Hold times can be longer because there's less noise to shake you out. Position sizing can be more aggressive because the risk per trade is contained.
In trending markets, wider stops are essential — tight stops get clipped by the larger intraday swings. Momentum setups outperform. Trailing stops capture more of the move. The key is being in the trade with enough room, regardless of direction.
In volatile markets, position sizing should shrink. Stop placement needs to account for gap risk. Hedging becomes more important. Strategy selection should favor high-liquidity names where you're less likely to get gapped through your stop.
You can make money in any direction if you correctly identify the character. But if you nail the direction and get the character wrong — you're sized for a calm market and it's actually volatile — you get stopped out even when you were right about the trend.
The VIX-Correlation matrix
 The second major finding was that VIX alone is an incomplete regime indicator. VIX tells you how much volatility the market expects, but not what kind.
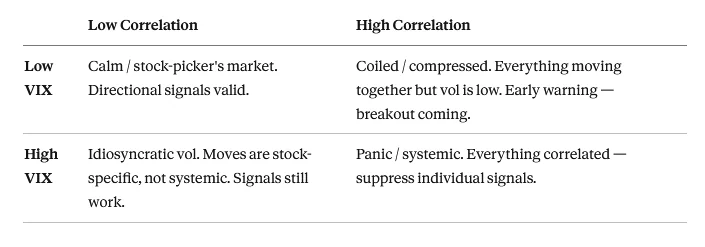
Adding implied correlation — specifically COR1M (1-month implied correlation), available from CBOE and also listed on Yahoo Finance as ^COR1M — creates a 2x2 matrix that dramatically improves character classification:
High VIX + Low Correlation → Dispersion / Idiosyncratic. This was the biggest practical unlock and the most robust finding (N=168). Most regime systems — ours included — used a blanket "suppress all signals when VIX is elevated" approach. But when VIX is high and correlation is low, the volatility is stock-specific, not systemic. The market isn't moving as a herd. Individual directional signals still work. Our data shows 66-71% accuracy for identifying trending conditions in this quadrant across 1-5 day horizons. That quadrant alone justified the entire exercise. Every signal our system suppressed during high-VIX / low-correlation periods was a missed opportunity. The blanket VIX gate was protecting us from a risk (systemic meltdown) that wasn't actually present.
High VIX + High Correlation → Panic / Systemic. This is the classic risk-off environment where everything sells together. Individual stock signals lose meaning because macro flows dominate. Our backtests show 62-79% accuracy for identifying volatile conditions in this quadrant (N=196), improving with longer horizons. In extreme cases where correlation spikes well above 50, the signal becomes very strong — though true systemic panics are rare enough that those extreme readings carry small sample sizes.
Low VIX + Low Correlation → Calm (stock-picker's market). Stocks are moving independently on individual fundamentals. This is where directional signals on individual names have maximum edge. When VIX is complacent, our system identifies calm conditions with 97-98% accuracy — the highest of any regime classification. This isn't surprising; calm markets tend to stay calm until an external shock arrives.
Low VIX + High Correlation → Coiled / Compressed. Everything is moving together even though implied volatility is low. This is an early warning signal — it often precedes breakouts. The calm surface masks building pressure.
Detecting transitions is the hard part
The 2x2 matrix works well for identifying steady-state regimes — when the market has settled into a character. The harder problem is detecting transitions between regimes: the moment calm flips to volatile, or trending flips to range-bound.
Our system tracks transition states explicitly (e.g., "Bull→Bear Transition"), but we'll be honest: transition accuracy is lower than steady-state accuracy. Regime transitions are inherently ambiguous — by the time the data clearly confirms a new regime, the transition is already over. This is an active area of improvement for us, and we suspect it's the frontier for the field generally.
What we changed
These findings led to several concrete changes in how our platform operates:
Split scoring. Every regime prediction is now independently scored on character accuracy and direction accuracy. The UI displays both — "Trending ✓ Bearish ✗" — so we can see exactly where the model has edge and where it doesn't. Direction accuracy is tracked but treated as a secondary metric.
Character-driven signal management. Instead of binary suppress/don't-suppress based on VIX levels, the regime character influences position sizing, stop width, and which types of setups are prioritized. This is a sliding scale, not an on/off switch.
Empirical base rate anchoring. Signal generation is anchored on historical win rates per character regime ("in trending conditions, the empirical swing win rate is X%") rather than trying to bias signals long or short based on direction.
Killed what didn't work. We tested correlation term structure (the COR1M/COR3M spread, analogous to VIX term structure) as an additional signal. It sounded promising in theory — short-term correlation spiking above medium-term should signal regime transition. In practice: 35% accuracy. Worse than random. We cut it immediately.
A real-time example
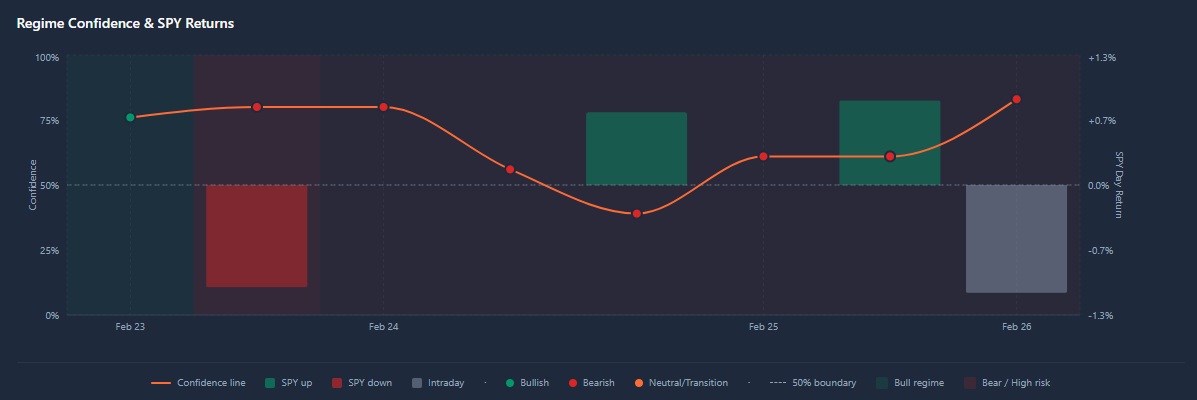
The week of February 23-26, 2026, our regime model called Bull→Bear Transition with Trending character for six consecutive sessions. SPY was rallying into NVIDIA earnings. The direction component of the call looked questionable — markets were going up while we were calling bearish transition.
Character confidence was 83%.
NVIDIA reported, the initial after-hours pop fully retraced, and the market followed through to the downside the next session.
The direction call was shaky throughout. The character call — trending, expect large directional moves — was correct. Traders who were sized and stopped for trending conditions rather than calm conditions were positioned appropriately regardless of which direction the move ultimately resolved.
Implications for builders
If you're building or evaluating any regime detection system:
- Score character and direction separately. A model that's 75% accurate on character and 50% on direction is genuinely useful. A model scored as "62% overall" by blending both dimensions hides the fact that one axis is working and the other isn't.
- Use correlation alongside volatility. VIX alone creates false equivalences between fundamentally different market conditions. The same VIX reading means very different things depending on whether stocks are moving together or independently.
- Calibrate thresholds empirically, and be honest about in-sample vs. out-of-sample. Our accuracy numbers were calibrated on historical data spanning Dec 2020 - Feb 2026. The live system has been running out-of-sample since mid-February 2026, and we'll publish those results separately once we have enough data for meaningful comparison. Backtest numbers always look better than live — the question is how much degradation there is.
- Let character drive position management. Use regime character for sizing, stop placement, and strategy selection. Reserve direction for tiebreaking between otherwise equivalent setups.
We publish our live regime calls with full split scoring at tradehorde.ai/regime, updated every session with scored outcomes.
The regime detection community is focused on predicting where the market goes. The edge, it turns out, is in predicting how it gets there.