
311 Signals Later: TradeHorde’s Conviction Edge Is Clearer
Across 311 public outcomes, signals scoring 50+ had a 55.1% win rate versus 36.6% below 50. From March to June, the eligible cohort shrank while its resolved win rate rose.
In March, after our first 112 resolved forecasts, I called TradeHorde’s conviction layer promising. The public record is now nearly three times as large.
This is the production record of an evolving multi-model AI system, not a test of one frozen version. We changed models, prompts, data, regime logic, scoring, and gates throughout the period.
As of July 19, 2026, the public Outcomes page showed 311 resolved signals: 141 wins, 170 losses, a 45.3% win rate, +0.35R per signal, and a 1.46 profit factor. R measures the result relative to the signal’s initial risk.
Conviction Score vs. Win Rate
TradeHorde maps the evidence behind each signal to a 0–100 conviction score. The formula evolved over this period; today it aggregates Bayesian-calibrated model hit rates across horizons, so higher scores reflect stronger verified model track records supporting the signal. The published buckets are Low (below 50), Conditional (50–69), and High (70+).
This is a bucket-level ranking, not a literal win probability.
| Conviction | Low | Conditional | High |
|---|---|---|---|
| Score | Below 50 | 50–69 | 70+ |
| Resolved | 164 | 114 | 33 |
| Wins / losses | 60 / 104 | 60 / 54 | 21 / 12 |
| Win rate | 36.6% | 52.6% | 63.6% |
Observed win rate increased with each conviction bucket. The strongest split was 50+ versus below 50. Signals scoring 50+ went 81–66: a 55.1% win rate, +0.62R per signal, and a 2.33 profit factor. Signals below 50 went 60–104: a 36.6% win rate, +0.11R per signal, and a 0.99 profit factor.
After resampling same-symbol, same-day clusters, the cluster-bootstrap 95% interval for the 50+ win-rate advantage remained entirely above zero: +7.2 to +29.3 percentage points.
Fewer Eligible Signals. Higher Observed Win Rate.
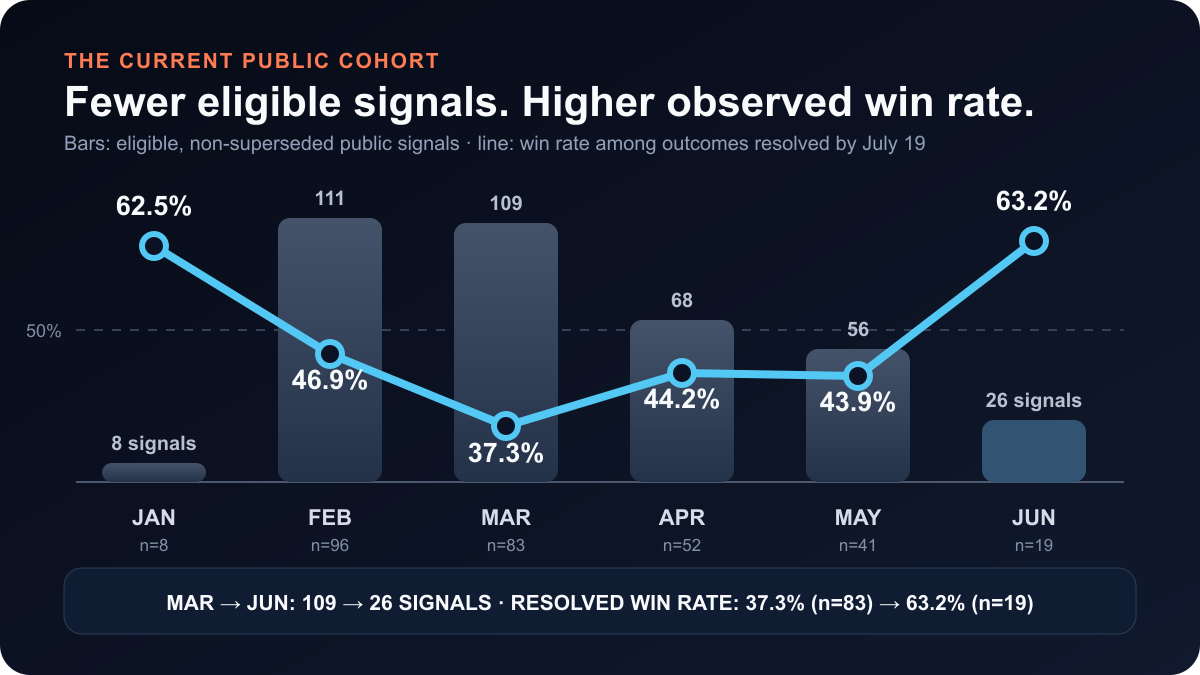
As of July 19, the eligible, non-superseded public cohort contained 26 June signals, down from 109 in March. Nineteen June signals had resolved: 12 wins, 7 losses, a 63.2% win rate, and +0.72R per signal. March had 83 resolved signals and a 37.3% win rate.
The v41 system was 11–7 across its first 18 resolved signals: a 61.1% win rate and +0.40R per signal. That is an early sample, but a strong one.
Higher Conviction Led in Both Simulations
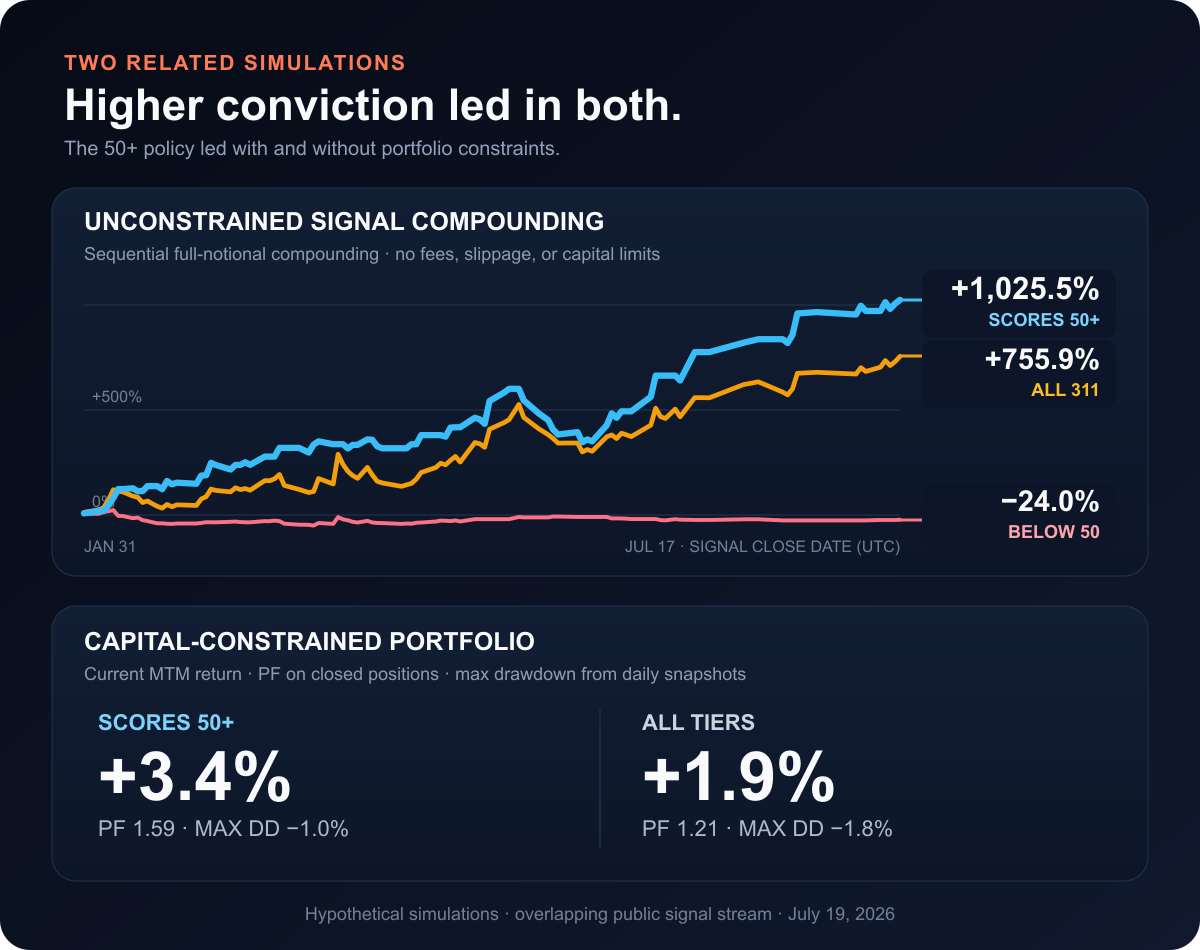
The unconstrained Outcomes curves ended at +1,025.5% for scores 50+, +755.9% for all tiers, and -24.0% for Low. Those figures come from hypothetical full-notional compounding; they are not investable returns.
Our portfolio tracker simulates cash, sizing, position limits, and current market values. In its July 19 snapshot, the 50+ policy was +3.4% marked to market, with a -1.0% maximum drawdown and a 1.59 profit factor on closed positions. The all-tier policy was +1.9% marked to market, with a -1.8% maximum drawdown and a 1.21 profit factor on closed positions.
Because both simulations use the same public signal stream, the same ordering is supporting evidence—not independent validation.
What 311 Signals Show
Conviction is not perfectly calibrated as a win probability. At 311 outcomes, it did what a ranking score should: observed win rate increased from Low to Conditional to High, with the clearest divide at 50.
Later cohorts were smaller, and June’s resolved signals had a higher observed win rate than March’s as of July 19. The complete eligible, non-superseded record remains public.
TradeHorde provides market analysis and ideas only. Signal outcomes are hypothetical, and portfolio outcomes are simulated; neither represents investor returns. Past performance does not guarantee future results.